

Charts
The app consists of 4 charts, after installation are displayed on the Dashboard (/page/dashboard).
After changing any of the settings, the diagrams will be rebuilt within a few minutes.
Top contents by likes
Displays the most popular N content items (defined in the Max number of items in the chart) from the apps selected in the Enabled for modules for the period defined in Interval in days.
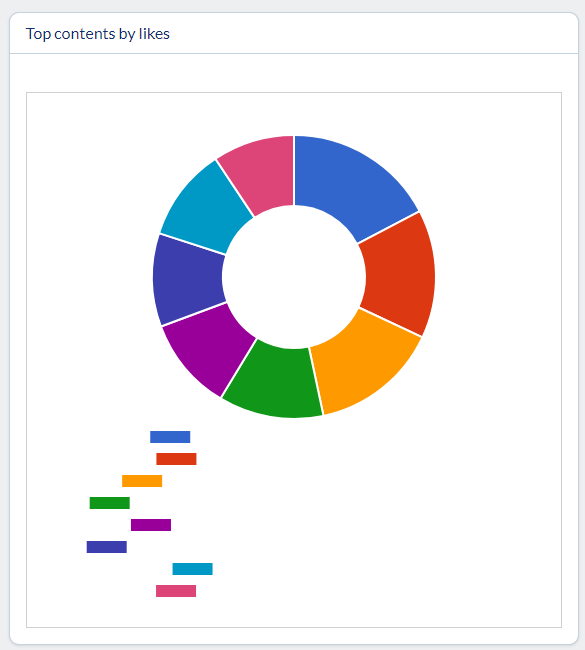
Settings
- Enabled for modules - select apps whose content is taken when collecting data
- Max number of items in the chart - number of content items, display on the chart
- Interval in days (0 for all data) - The time interval to collect data for chart
Most active profiles
Displays the most popular N profiles (defined in the Max number of items in the chart) from the apps selected in Profiles modules and active in the apps selected in Modules to count content in the period defined in Interval in days.
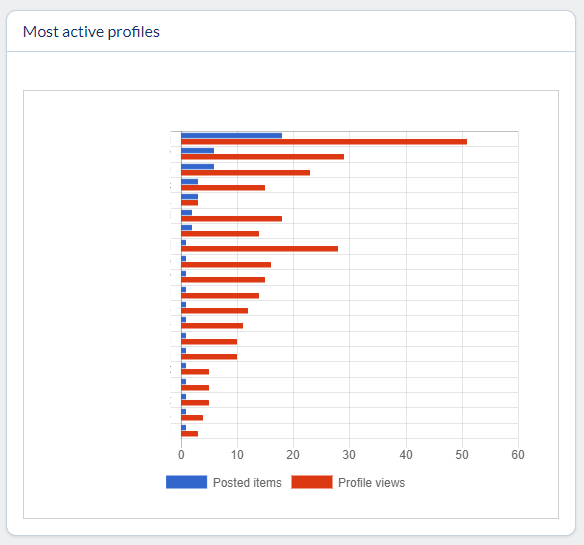
Settings
Profiles modules - list of profile apps for collect data
- Modules to count content in - list of content apps for collect data
- Max number of items in the chart - number of content items, display on the chart
- Interval in days (0 for all data) - The time interval to collect data for chart
Most followed profiles
Displays the most popular N profiles (defined in the Max number of items in the chart) from the modules selected in Most followed profiles for the period defined in Interval in days.
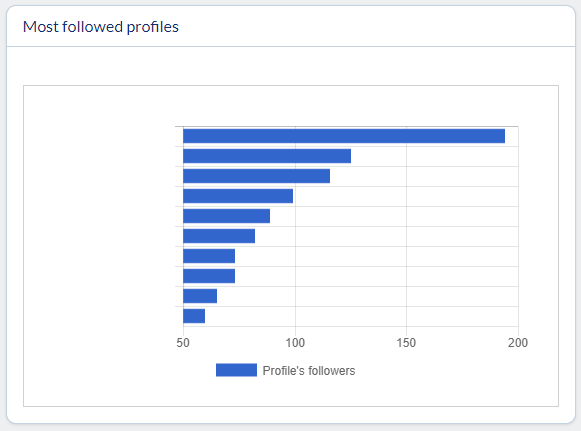
Settings
- Most followed profiles - list of profile apps for collect data
- Max number of items in the chart - number of content items, display on the chart
- Interval in days (0 for all data) - The time interval to collect data for chart
Content growth
Displays the growth of content for the list of modules defined in Enabled for the period defined in Interval in days and grouped by Group by.
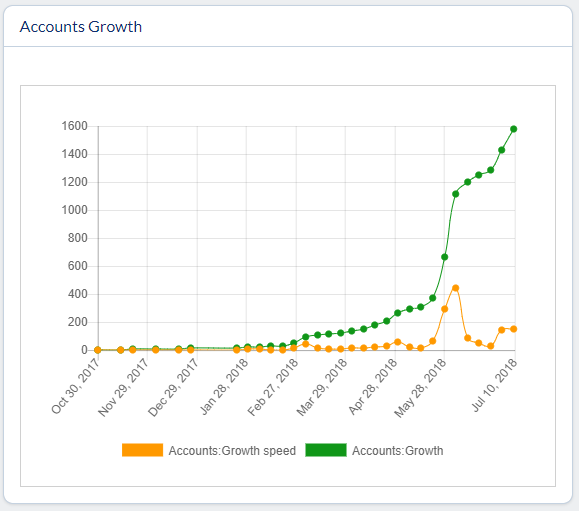
Settings
- Enabled for - list of apps for collect data
- Interval in days (0 for all data) - The time interval to collect data for chart
- Group by - interval for groupping data (day/week/year)